Case study · Documents & language
Multi-agent equity research
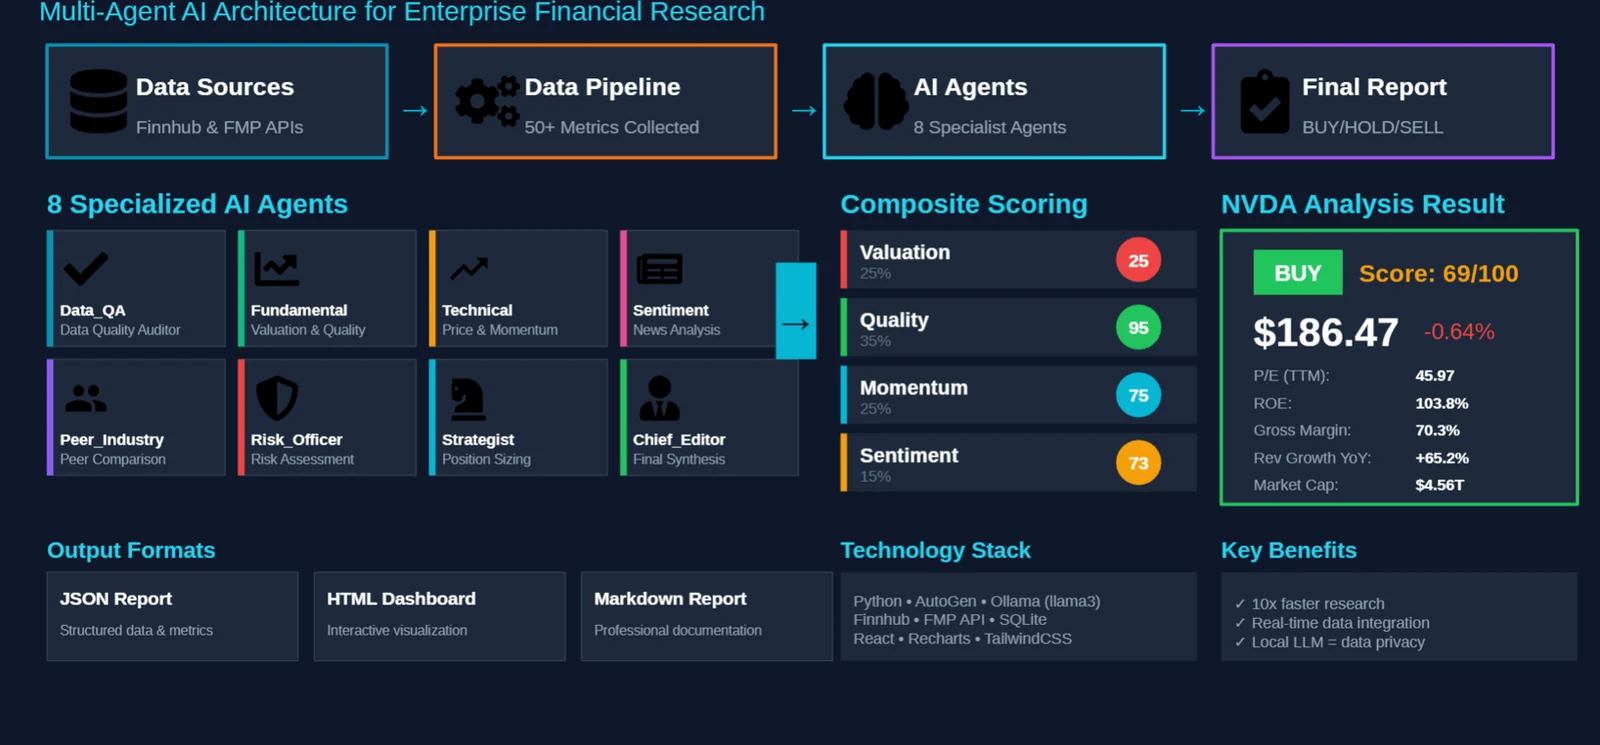
A multi-agent system for enterprise financial research. Eight specialist agents (from a data-quality auditor to a chief editor) analyze a company from every angle, score it on an explicit weighted rubric and publish the result as a structured report, a dashboard and a document. The model runs locally.
Business result
First-pass company research, which used to mean hours of collecting and reconciling data, is drafted automatically. Every score is traceable to its inputs, and proprietary questions never leave the building because the model runs locally.
Client type
Industry project
Where this applies for you
Research, due-diligence and analyst teams that need speed without sending sensitive questions to an outside API.
Technical result
- 8specialist agentsEach with one role and one structured output
- 50+metrics per companyCollected from Finnhub and FMP market-data APIs
- 10×faster first-pass researchProject estimate versus manual collection and analysis
The problem
Analysts spend most of their time collecting and reconciling data before any judgment happens: fundamentals, price action, peers, news sentiment, risk. Off-the-shelf chat assistants could summarize, but couldn’t be trusted with numbers, and sending proprietary research questions to an external API was not acceptable.
What we built
We split the analyst’s job into eight roles and gave each its own agent, with a data-quality agent checking inputs before anyone reasons over them and a chief editor synthesizing the final call. Scores combine on an explicit weighting (valuation, quality, momentum, sentiment) so every recommendation is traceable to its parts. Llama 3 runs locally through Ollama, keeping data on-premise.
Workflow
How it works, step by step.
The pipeline in 5 stages, from collect to report. Each stage has a clear input, a clear output and a reason to exist.
- 01
Collect
Market and fundamentals data pulled from the Finnhub and FMP APIs and stored in SQLite.
- 02
Prepare
A data pipeline computes 50+ metrics per company; the Data-QA agent audits them before analysis.
- 03
Analyze
Fundamental, technical, sentiment, peer and risk agents each produce a scored view; a strategist sizes the position.
- 04
Score
A composite score weights valuation 25%, quality 35%, momentum 25% and sentiment 15%.
- 05
Report
The chief-editor agent writes the BUY/HOLD/SELL report as JSON, an HTML dashboard and Markdown.
Results
What it produced.
The eight agents
- Data QAData-quality auditor
- FundamentalValuation & quality
- TechnicalPrice & momentum
- SentimentNews analysis
- Peer / IndustryPeer comparison
- Risk OfficerRisk assessment
- StrategistPosition sizing
- Chief EditorFinal synthesis
Composite scoring · example run
Weighted: 0.25·25 + 0.35·95 + 0.25·75 + 0.15·73 ≈ 69. Every recommendation decomposes into the scores that produced it.
Example run on NVIDIA (NVDA) during development. System output shown for illustration only, not investment advice.
Stack & techniques
- Python
- AutoGen
- Ollama
- Llama 3
- Finnhub API
- FMP API
- SQLite
- React
- Recharts
- Tailwind CSS
Delivered by members of the Saerosense founding team. Client names are withheld unless public. References are available on request.
Start a project
Have a similar problem?
Send a few lines about your data and the outcome you want. We reply within 1 business day with an honest read and a proposed scoping plan.